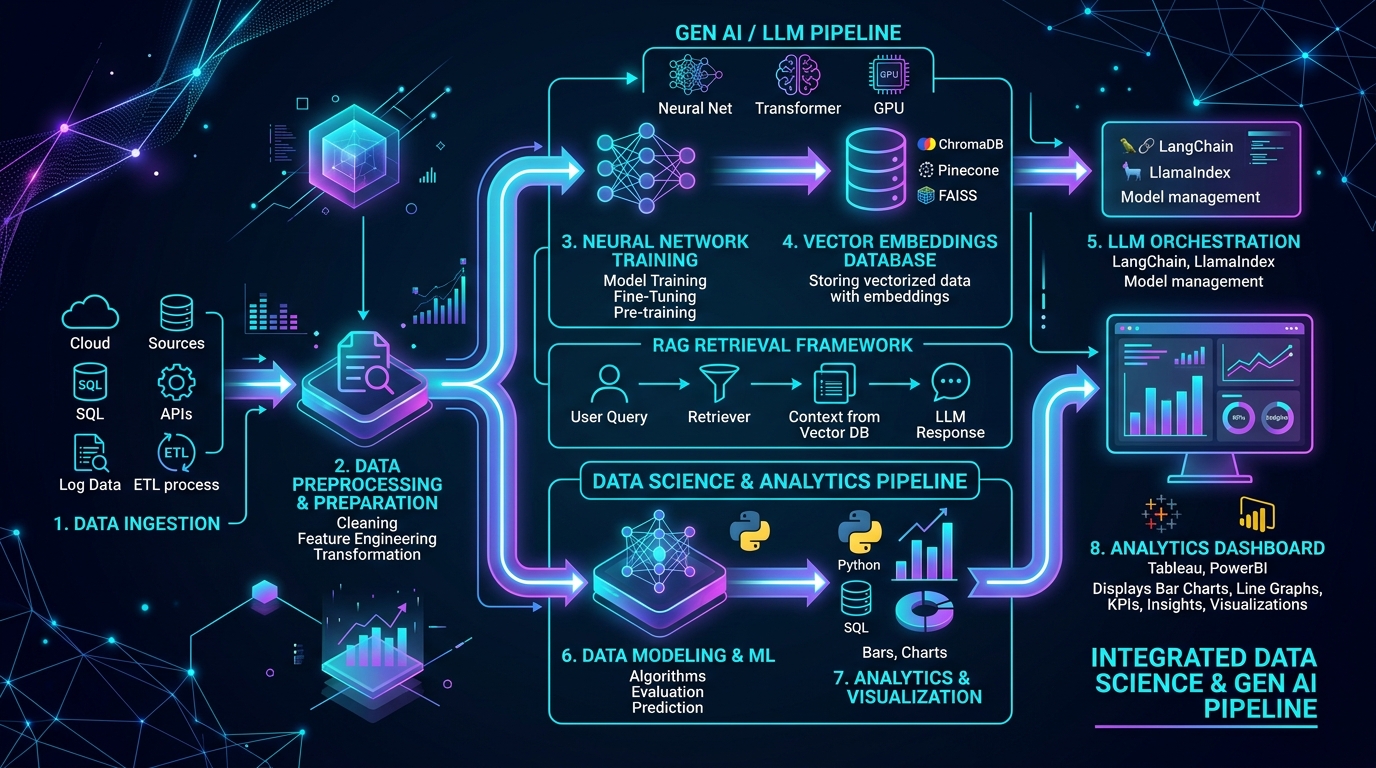
Data Science Interview Guide: Statistics, Machine Learning, SQL & Case Studies
What You'll Learn in This Masterclass
Machine Learning Algorithm Selection & Trade-off Matrix
| Algorithm | Type | Strengths | Weaknesses / Bottlenecks | Best Use Case |
|---|---|---|---|---|
| Logistic Regression | Linear Classifier | Fast inference, highly interpretable, outputs calibrated probabilities | Cannot capture non-linear relationships without manual feature crosses | Baseline modeling, credit scoring, medical risk assessment |
| Random Forest | Bagging Ensemble | Reduces variance, robust to outliers, handles tabular mixed types well | Large memory footprint, slower real-time inference on millions of trees | General tabular predictive modeling with default hyperparameters |
| XGBoost / LightGBM | Boosting Ensemble | State-of-the-art accuracy on tabular data, built-in missing value handling | Prone to overfitting if hyperparameters are not tuned; sensitive to noise | Kaggle competitions, search ranking, click-through-rate (CTR) prediction |
| K-Means Clustering | Unsupervised | Simple O(N*K*I) complexity, scales well to large datasets | Assumes spherical clusters; sensitive to initialization (mitigated by K-Means++) | Customer segmentation, anomaly detection pre-filtering |
Visual Architecture & Process Diagrams
The iterative pipeline from business problem definition to data preprocessing, model selection, tuning, and production A/B testing.
1. Probability & Statistical Foundations for Modeling
A solid statistical ground separates data scientists who blindly run scikit-learn models from those who understand model assumptions and failure modes.
Bayes' Theorem & Conditional Probability
- Formula:
P(A|B) = [P(B|A) * P(A)] / P(B). - Medical / Fraud Testing Paradox: Explains why a rare disease (prevalence 0.1%) tested with a 99% accurate test yields a low positive predictive value (PPV). In interviews, panels regularly test whether you can calculate posterior probabilities on imbalanced distributions.
The Central Limit Theorem (CLT)
- The sampling distribution of the sample mean approaches a Normal Distribution as the sample size increases (typically
n >= 30), regardless of the underlying population distribution, provided observations are independent and identically distributed (i.i.d.). This theorem serves as the theoretical justification for Z-tests, T-tests, and parametric A/B testing.
2. Bias-Variance Decomposition & Regularization (Lasso vs. Ridge)
Total Expected Generalization Error decomposes into:
Total Error = Bias^2 + Variance + Irreducible Error
- High Bias (Underfitting): The model is too simple to capture underlying patterns (e.g. fitting linear regression to quadratic data). High training error and high test error.
- High Variance (Overfitting): The model memorizes training noise rather than true population signals. Low training error, but high test error.
L1 (Lasso) vs. L2 (Ridge) Regularization
- L1 Regularization (Lasso): Adds penalty proportional to absolute weights (
λ * Σ|w_i|). Because the L1 constraint region is diamond-shaped with sharp corners along the coordinate axes, optimization pushes non-essential feature weights to exactly zero, performing automatic feature selection. - L2 Regularization (Ridge): Adds penalty proportional to squared weights (
λ * Σ(w_i^2)). Shrinks feature coefficients asymptotically toward zero without zeroing them out, effectively handling collinear features.
3. Evaluation Metrics: ROC-AUC, PR-AUC & Imbalanced Classes
Accuracy is a dangerous metric when dealing with imbalanced datasets (e.g., fraud detection where 99.8% of transactions are legitimate). A naive model predicting "Non-Fraud" for all transactions achieves 99.8% accuracy while failing 100% of the business objective.
Precision vs. Recall
- Precision (`TP / (TP + FP)`): Out of all instances predicted as positive, how many are truly positive? Prioritize when the cost of False Positives is high (e.g., spam detection, video recommendation).
- Recall / Sensitivity (`TP / (TP + FN)`): Out of all actual positive instances, how many did the model capture? Prioritize when the cost of False Negatives is catastrophic (e.g., cancer diagnosis, credit card fraud).
ROC-AUC vs. Precision-Recall (PR) AUC
- ROC Curve (TPR vs. FPR): Evaluates overall ranking ability across all decision thresholds. However, on highly skewed datasets with massive true negatives, FPR remains artificially low, giving an overly optimistic view of model performance.
- PR Curve (Precision vs. Recall): Does not include True Negatives in its calculation, providing an honest, rigorous evaluation on severely imbalanced datasets.
High-Frequency Interview Questions & Frameworks
Explain the bias-variance trade-off mathematically and how Bagging (Random Forests) vs Boosting (XGBoost) address it differently.
In a binary classification problem for ad click-through-rate (CTR) prediction, our dataset has only 0.1% positive clicks. How do you design the feature pipeline and model evaluation strategy?
Costly Mistakes to Avoid
- ✕Evaluating models on severely imbalanced datasets using Accuracy or ROC-AUC instead of Precision-Recall curves.
- ✕Performing feature scaling or imputation on the entire dataset before train-test splitting (causing data leakage).
- ✕Failing to tune tree regularization parameters (max_depth, min_child_weight, subsample) in gradient boosting models.
- ✕Believing correlation implies causation without running randomized controlled experiments or causal inference models.
- ✕Ignoring probability calibration when model predictions are used for downstream financial or ranking decisions.
Key Takeaways
- •Data science in product firms is about generating business value and causal lift, not training black-box models in isolation.
- •Bagging primarily reduces variance; boosting primarily reduces bias.
- •Always use Precision-Recall AUC and Log-Loss over Accuracy when working with imbalanced datasets.
- •Data leakage during preprocessing is the most common cause of models that perform brilliantly offline but fail in production.
Final Interview Checklist
- Be able to write the mathematical formula for Bayes’ Theorem and calculate posterior probability on a whiteboard.
- Understand the mathematical derivation of Ordinary Least Squares (OLS) regression and Logistic regression log-odds.
- Derive the cost functions for L1 (Lasso) and L2 (Ridge) regularization.
- Explain how Decision Trees calculate split purity using Gini Impurity vs Information Gain (Entropy).
- Know how to interpret SHAP (Shapley Additive exPlanations) values for model explainability.
- Design an end-to-end A/B test including sample size power calculation, randomization unit, and guardrail metrics.
Frequently Asked Questions (FAQs)
What is the difference between supervised, unsupervised, and semi-supervised learning?
Supervised learning trains on labeled data pairs (X, y) to predict continuous targets (regression) or discrete categories (classification). Unsupervised learning discovers hidden patterns or clusters in unlabeled inputs (X) without target feedback. Semi-supervised learning leverages a small amount of labeled data combined with a large volume of unlabeled data to improve model accuracy cost-effectively.
What is data leakage and how do you prevent it?
Data leakage occurs when information from outside the training dataset (such as future events or test set statistics) is inadvertently used to train the model. Prevent it by: 1. Splitting data strictly by timestamp for time-series data. 2. Performing all preprocessing (imputation, scaling, encoding) strictly inside cross-validation pipelines (e.g., scikit-learn Pipeline).
What is the difference between bagging and boosting?
Bagging (Bootstrap Aggregation) trains multiple independent models in parallel on random sub-samples with replacement, combining their outputs via majority voting or averaging to reduce variance. Boosting trains models sequentially, where each new model focuses on correcting the errors and residuals of previous models, primarily reducing bias.
How does the K-Means clustering algorithm work and how do you choose K?
K-Means randomly initializes K centroids, assigns each data point to its nearest centroid, and iteratively recomputes centroids as the mean of assigned points until convergence. Choose optimal K using the Elbow Method (within-cluster sum of squares inertia), Silhouette Analysis (cluster cohesion vs separation), or business interpretability.
What is cross-validation and why is K-Fold preferred over a single train-test split?
Cross-validation partitions data into K subsets, iteratively training on K-1 folds and validating on the remaining fold. It provides a reliable estimate of generalization performance across the entire dataset, mitigating the variance and luck associated with a single arbitrary train-test split.
What is the purpose of PCA (Principal Component Analysis)?
PCA is an unsupervised linear dimensionality reduction technique that transforms correlated features into a smaller set of orthogonal, uncorrelated variables called Principal Components, ordered by the amount of original variance they retain.
What is the difference between parametric and non-parametric machine learning models?
Parametric models (Linear Regression, Logistic Regression) assume a fixed mathematical form for the target function and have a fixed number of parameters regardless of data size. Non-parametric models (Decision Trees, K-Nearest Neighbors) do not make strong assumptions about the functional form and can flexibly grow their parameters as training data expands.
How do you interpret a p-value in hypothesis testing?
A p-value is the probability of observing test results at least as extreme as the actual observed results, assuming that the null hypothesis is true. A p-value is NOT the probability that the null hypothesis is true.
Authoritative References & Standards
The premier mathematical reference on supervised and unsupervised statistical learning theory.
Foundational textbook on Bayesian inference, graphical models, and machine learning mathematics.